大数据分析——某电商平台药品销售数据分析
一、 选题背景
我们已经习惯了在网上购买衣服、数码产品和家用电器,但是在网上买药品的还是不多。据史国网上药店理事会调查报告显示:2022 年,医药 B2C 的规模达到 4 亿元,仅出现 5 家锁售额达.5000 万元的网上药店。而 2022 年医药行业的市场规模达到3718 亿,线上药品的销售额还不到网下药店的一个零头,还有很大的发展潜力。大数据的不断发展影响消费者生活的各个方面,也对企业的营销模式提出挑站对大 数据量化分析,分析数据中的相关性分析,单因素分析等技术对消费者相关数据进行分析,能够挖掘出对企业真正有意义的信息。这就要求企业在有现的人力、物力资源下, 更新并找出合理的销售方案。对于医药企业来说,大数据为企业带来了危机也带来了商机,企业应根据自身发展阶段及药品特征,以及顾客价值最大化作为方向,以信息化为手段,并根据市场对药品需求的变化,把握消费者的个性需求,进行精准营销,与消费者建立起良性有效的互动,及时获得消费者反馈,整合传统媒体与新媒体宣传资源,选择合适的企业发展的营销战略。
二、 大数据分析设计方案
1.本数据集的数据内容数据特征分析
本数据集是一份网络电商平台的药品销售数据集,共7个字段,包括购药时间(string),社保卡号(int),商品编码(int),商品名称(string),销售数量(int),应收金额(int),实收金额(int)。
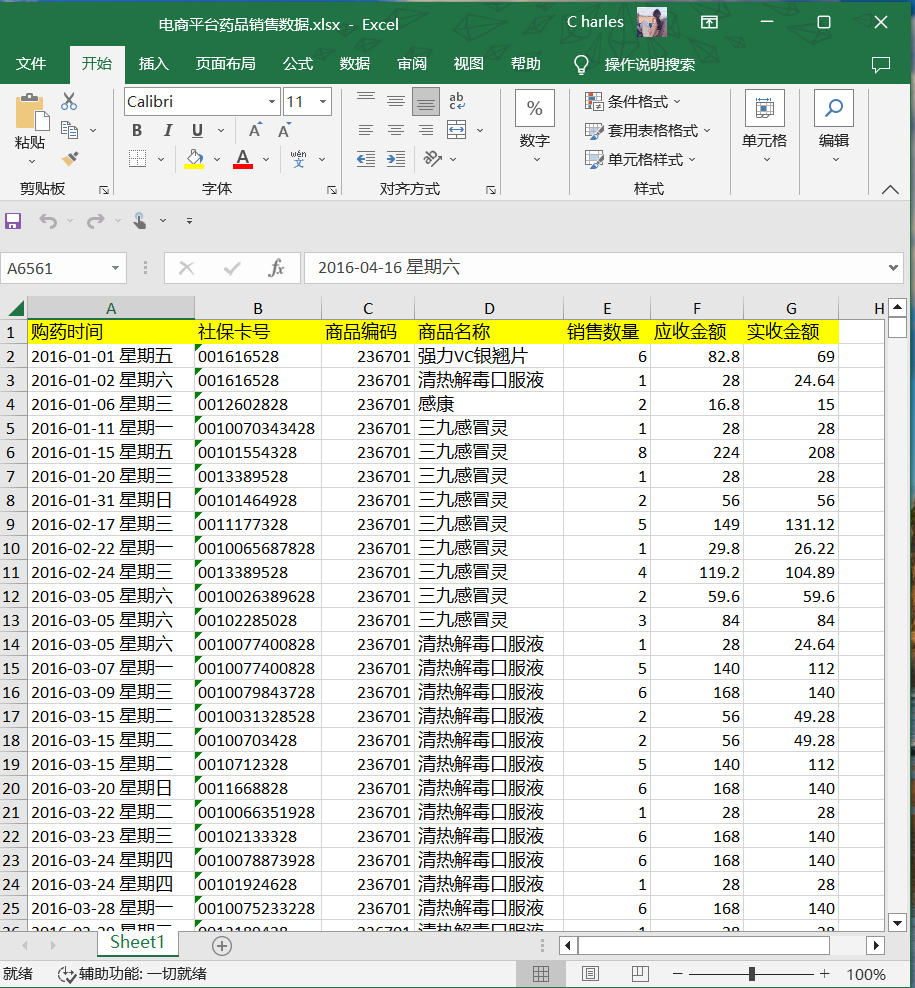
2.数据分析的课程设计方案概述
(1)先对数据进行预处理和清洗
(2)数据分析和可视化
(3)随机森林填补缺失值
三、数据分析步骤
1.数据源
数据集来源于国外Kaggle数据集网站进行采集。源数据集网址
https://www.kaggle.com/datasets/jack20216915/yaopin
导入库

import pandas as pd
import stylecloud
from PIL import Image
from collections import Counter
from pyecharts.charts import Bar
from pyecharts.charts import Line
from pyecharts.charts import Calendar
from pyecharts import options as opts
from pyecharts.commons.utils import JsCode
from pyecharts.globals import SymbolType

读取数据集
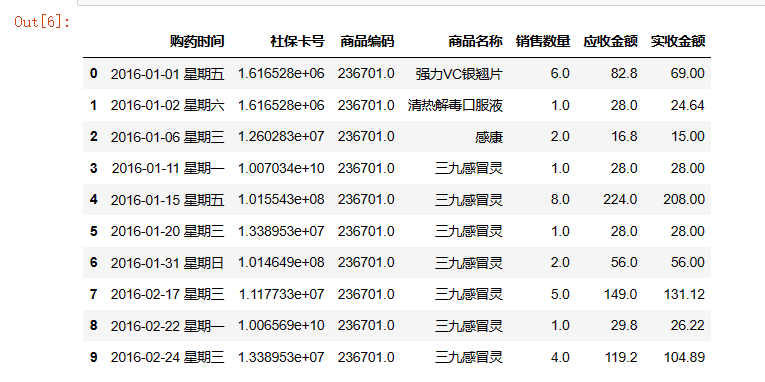
df = pd.read_excel('电商平台药品销售数据.xlsx')
df.head(10)
2数据清洗
数据清洗, 是整个数据分析过程中不可缺少的一个环节,其结果质量直接关系到模型效果和最终结论。在实际操作中,数据清洗通常会占据分析过程的50%—80%的时间。
(1)查看索引、数据类型和内存信息
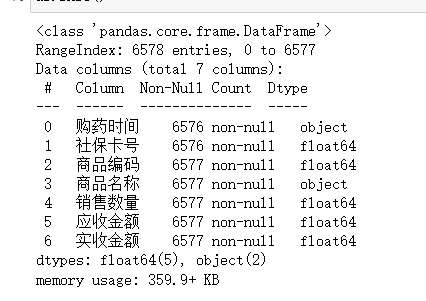
info() 函数用于打印 DataFrame 的简要摘要,显示有关 DataFrame 的信息,包括索 引的数据类型 dtype 和列的数据类型 dtype,非空值的数量和内存使用情况
df.info()
(2)统计空值数据
使用 isnull() 函数时不需要传入任何参数,只需要使用 df 对象去调用它就可以了。 该方法运行之后会将整个表格对象内的所有数据都转为 True 值以及 False 值,其中 NaN 值转换之后得到就是 True
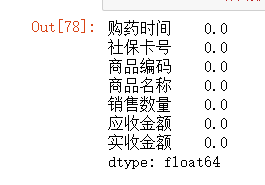
df.isnull().sum()
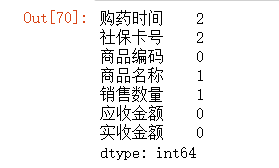
(3) 输出包含空值的行

因为购药时间在后面的分析中会用到,所以我们将购药时间为空的行删除

(4)社保卡号用”000” 填充
fillna() 函数的功能: 该函数的功能是用指定的值去填充 dataframe 中的缺失值
df1['社保卡号'].fillna('0000', inplace=True)
df1.isnull().sum()
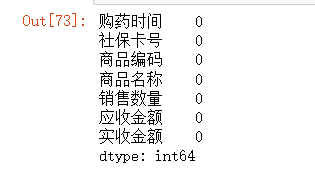
此时可以看到没有空值了
(5)社保卡号、商品编码为一串数字,应为 str 类型,销售数量应为 int 类型
df1['社保卡号'] = df1['社保卡号'].astype(str)
df1['商品编码'] = df1['商品编码'].astype(str)
df1['销售数量'] = df1['销售数量'].astype(int)
df1.info()
df1.head()
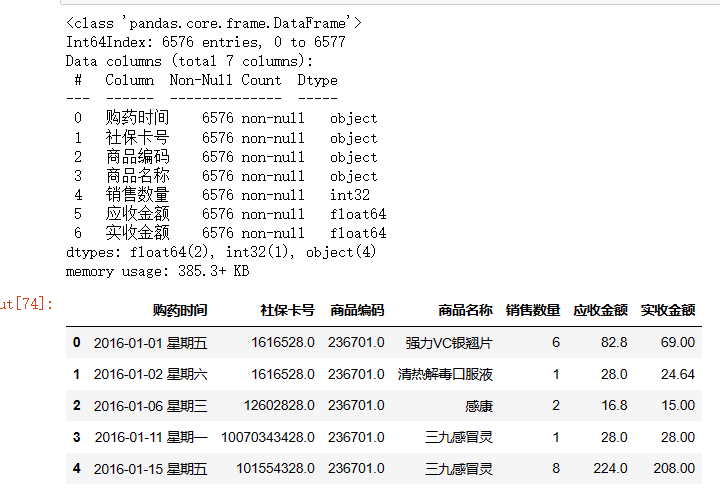
虽然这里强制转换社保卡号、商品编码为 str 类型,但是在读取表格的时候是以 float 读取的,所以存在小数点,这里我们可以在读取表格文件时指定相应列的数据类型 (需要注意如果数据存在空值,那么转换数值型时会失效):
df_tmp = pd.read_excel('电商平台药品销售数据.xlsx', converters={'社保卡号':str, '商品编码':str, '销售数量':int})
df_tmp.head()

(6)销售数量、应收金额、实收金额分布情况
df2 = df_tmp.copy()
df2 = df2.dropna(subset=['购药时间'])
df2['社保卡号'].fillna('0000', inplace=True)
df2['销售数量'] = df2['销售数量'].astype(int)
df2[['销售数量','应收金额','实收金额']].describe()
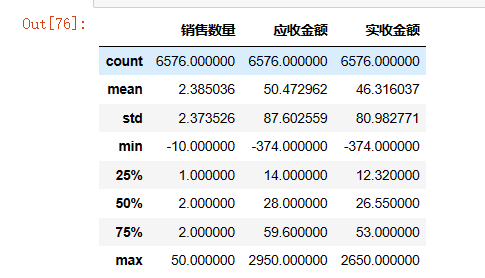
数据中存在负值,显然不合理,我们看一下负值所在的行
df2.loc[(df2['销售数量'] < 0)]
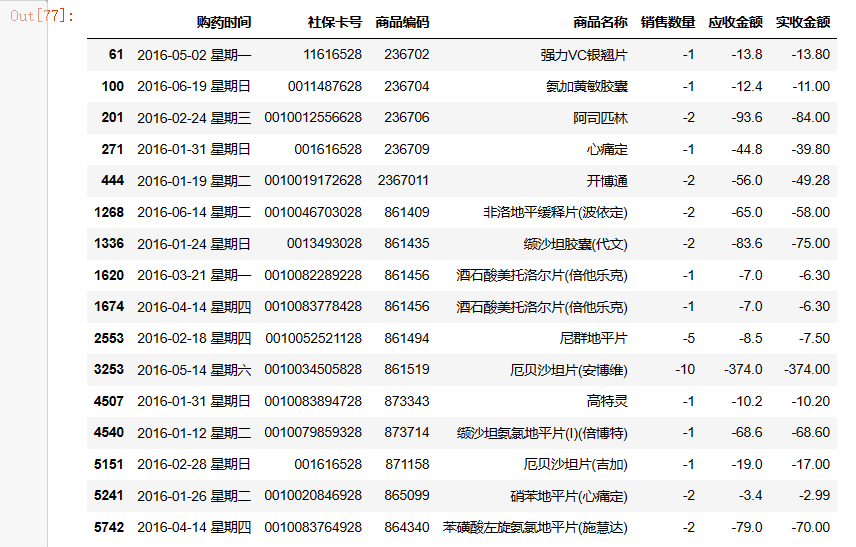
(7)负值转正值
abs 是 python 的绝对值函数,计算绝对值,数据值转为正值
df2['销售数量'] = df2['销售数量'].abs()
df2['应收金额'] = df2['应收金额'].abs()
df2['实收金额'] = df2['实收金额'].abs()
df2.loc[(df2['销售数量'] < 0) | (df2['应收金额'] < 0) | (df2['实收金额'] < 0)].sum()
(8)列拆分(购药时间列拆分为两列)
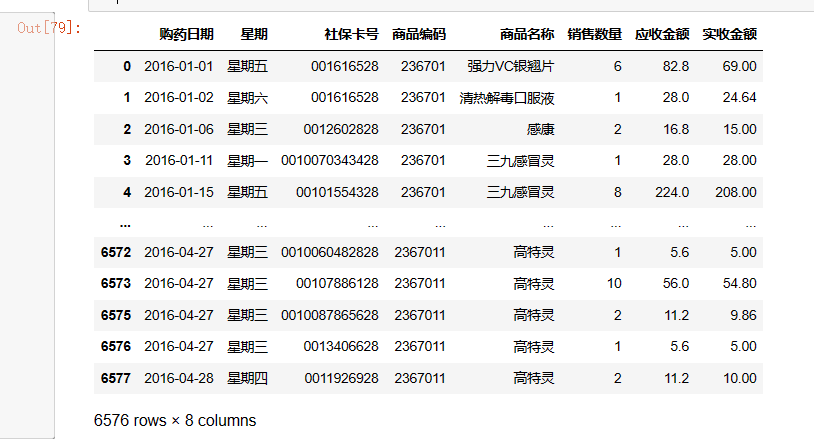
对字符串按照指定规则分割,并将分割后的字段作为 list 返回,对购药日期和星期 两列进行分隔,进行列拆分
df3 = df2.copy()
df3[['购药日期', '星期']] = df3['购药时间'].str.split(' ', 2, expand = True)
df3 = df3[['购药日期', '星期','社保卡号','商品编码', '商品名称', '销售数量', '应收金额', '实收金额' ]]
df3
(9) 数据时间范围
unique 函数去除其中重复的元素,并按元素由大到小返回一个新的无元素重复的元组或者列表
len(df3['购药日期'].unique())
df3.groupby('购药日期').sum()
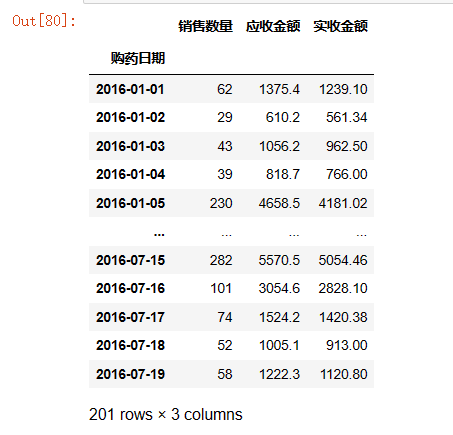
一共201个购买日期,时间范围2016-01-01至2016-07-19
3数据可视化
“pyecharts 是一个用于生成 Echarts 图表的类库。Echarts 是百度开源的一个数据可视化 JS 库。用 Echarts 生成的图可视化效果非常棒,为了与 Python 进行对接,方便在 Python 中直接使用数据生成图”。
pyecharts可以展示动态图,在线报告使用比较美观,并且展示数据方便,鼠标悬停在图上,即可显示数值、标签等。
(1)一周各天药品销量柱状图
color_js = """new echarts.graphic.LinearGradient(0, 1, 0, 0,
    [{offset: 0, color: '#FFFFFF'}, {offset: 1, color: '#ed1941'}], false)"""
g1 = df3.groupby('星期').sum()
x_data = list(g1.index)
y_data = g1['销售数量'].values.tolist()
b1 = (
        Bar()
        .add_xaxis(x_data)
        .add_yaxis('',y_data ,itemstyle_opts=opts.ItemStyleOpts(color=JsCode(color_js)))
        .set_global_opts(title_opts=opts.TitleOpts(title='一周各天药品销量',pos_top='2%',pos_left = 'center'),
            legend_opts=opts.LegendOpts(is_show=False),
            xaxis_opts=opts.AxisOpts(axislabel_opts=opts.LabelOpts(rotate=-15)),
            yaxis_opts=opts.AxisOpts(name="销量",name_location='middle',name_gap=50,name_textstyle_opts=opts.TextStyleOpts(font_size=16)))
    )
b1.render('一周各天药品销量柱状图.html')
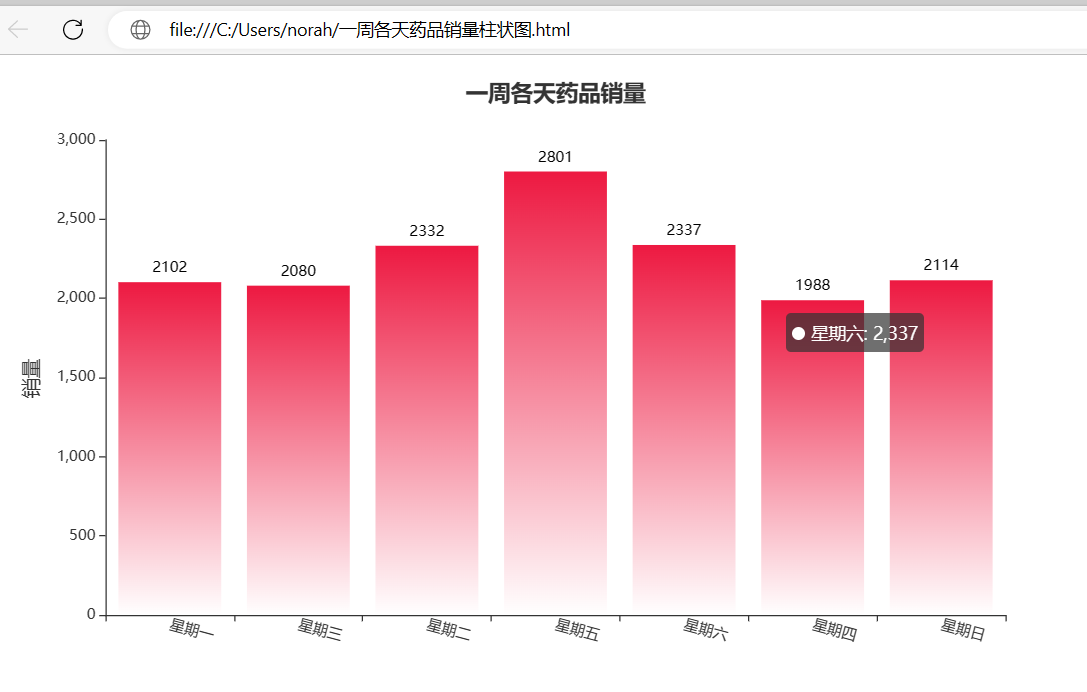
从下图可以清楚直观的看到每一周药品的销量,我发现每天销量整体相差不大,周五、周六偏于购药高峰。
(2)药品销量前十柱状图
color_js = """new echarts.graphic.LinearGradient(0, 1, 0, 0,
    [{offset: 0, color: '#FFFFFF'}, {offset: 1, color: '#08519c'}], false)"""
g2 = df3.groupby('商品名称').sum().sort_values(by='销售数量', ascending=False)
x_data = list(g2.index)[:10]
y_data = g2['销售数量'].values.tolist()[:10]
b2 = (
        Bar()
        .add_xaxis(x_data)
        .add_yaxis('',y_data ,itemstyle_opts=opts.ItemStyleOpts(color=JsCode(color_js)))
        .set_global_opts(title_opts=opts.TitleOpts(title='药品销量前十',pos_top='2%',pos_left = 'center'),
            legend_opts=opts.LegendOpts(is_show=False),
            xaxis_opts=opts.AxisOpts(axislabel_opts=opts.LabelOpts(rotate=-15)),
            yaxis_opts=opts.AxisOpts(name="销量",name_location='middle',name_gap=50,name_textstyle_opts=opts.TextStyleOpts(font_size=16)))
    )
b2.render('药品销量前十柱状图.html')
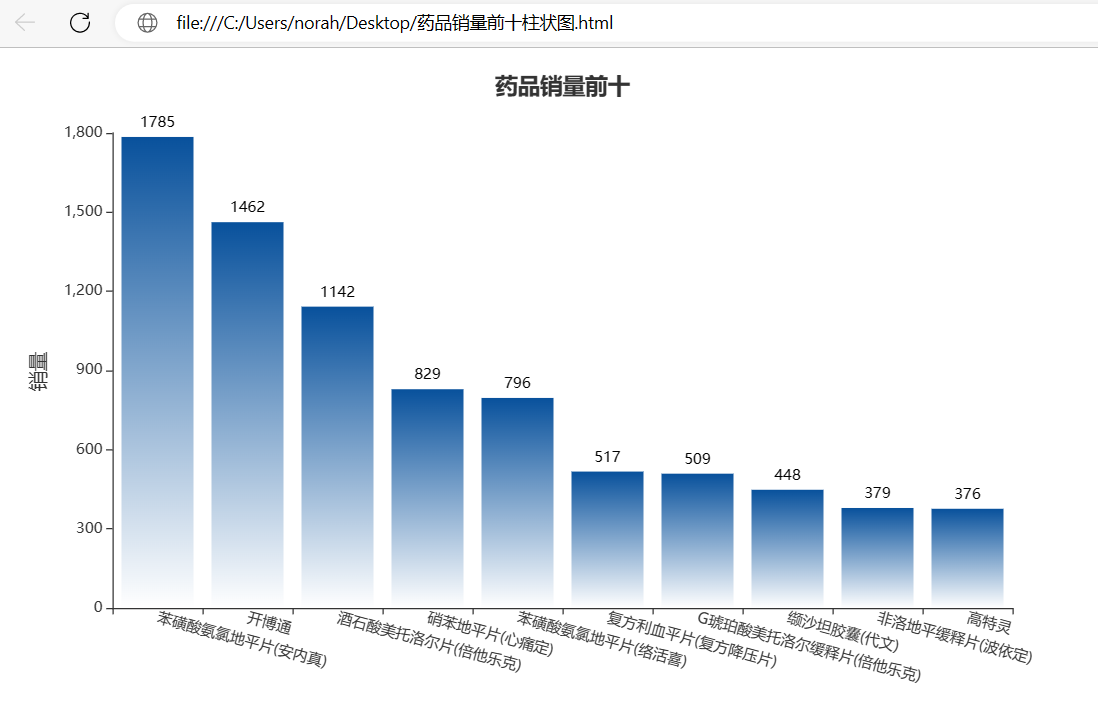
我们在这可以看出:苯磺酸氨氯地平片 (安内真)、开博通、酒石酸美托洛尔片 (倍他乐克) 等治疗高血压、心绞痛药物购买量比较多
(3)药品销售额前十柱状图
color_js = """new echarts.graphic.LinearGradient(0, 1, 0, 0,
    [{offset: 0, color: '#FFFFFF'}, {offset: 1, color: '#871F78'}], false)"""
g3 = df3.groupby('商品名称').sum().sort_values(by='实收金额', ascending=False)
x_data = list(g3.index)[:10]
y_data = g3['实收金额'].values.tolist()[:10]
b3 = (
        Bar()
        .add_xaxis(x_data)
        .add_yaxis('',y_data ,itemstyle_opts=opts.ItemStyleOpts(color=JsCode(color_js)))
        .set_global_opts(title_opts=opts.TitleOpts(title='药品销售额前十',pos_top='2%',pos_left = 'center'),
            legend_opts=opts.LegendOpts(is_show=False),
            xaxis_opts=opts.AxisOpts(axislabel_opts=opts.LabelOpts(rotate=-15)),
            yaxis_opts=opts.AxisOpts(name="销量",name_location='middle',name_gap=50,name_textstyle_opts=opts.TextStyleOpts(font_size=16)))
    )
b3.render('药品销售额前十柱状图.html')
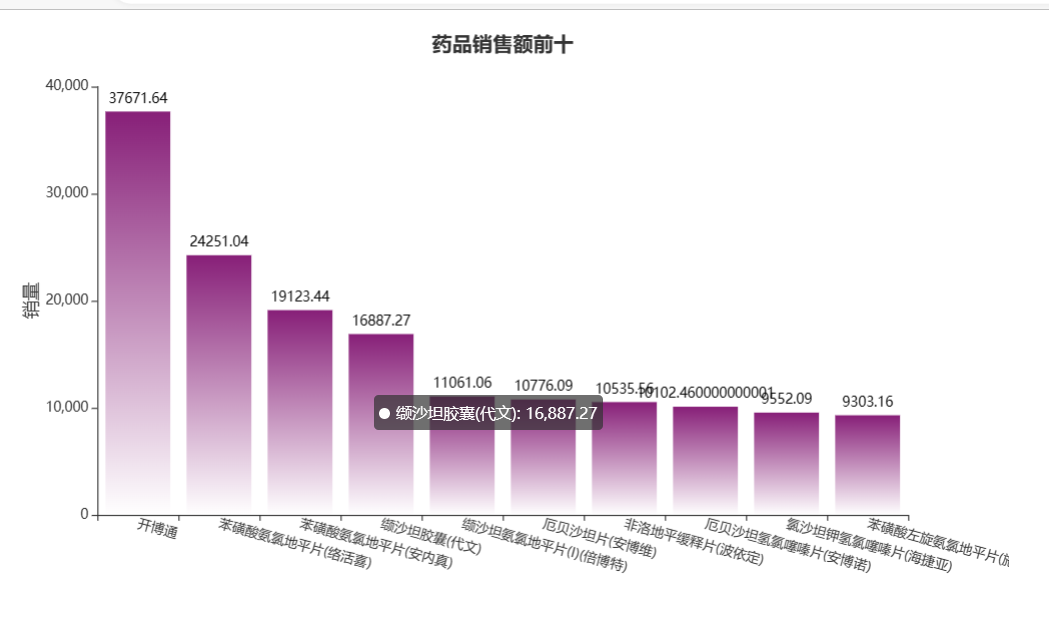
我们可以清楚看到药品销售额前十的条形图,我们发现开播通销售额最高,为37671
(4)一周每天订单量
# 设置样式
color_js = """new echarts.graphic.LinearGradient(0, 1, 0, 0,
    [{offset: 0, color: '#25BEAD'}, {offset: 1, color: '#ed1941'}], false)"""
area_color_js = (
    "new echarts.graphic.LinearGradient(0, 0, 0, 1, "
    "[{offset: 0, color: '#25BEAD'}, {offset: 1, color: '#3fbbff0d'}], false)"
)
# 一周每天订单量
df_week = df3.groupby(['星期'])['实收金额'].count()
week_x_data = df_week.index
week_y_data = df_week.values.tolist()
line1 = (
    Line(init_opts=opts.InitOpts(bg_color=JsCode(color_js)))
    .add_xaxis(xaxis_data=week_x_data)
    .add_yaxis(
        series_name="",
        y_axis=week_y_data,
        is_smooth=True,
        is_symbol_show=True,
        symbol="circle",
        symbol_size=6,
        linestyle_opts=opts.LineStyleOpts(color="#fff"),
        label_opts=opts.LabelOpts(is_show=True, position="top", color="white"),
        itemstyle_opts=opts.ItemStyleOpts(
            color="red", border_color="#fff", border_width=3
        ),
        tooltip_opts=opts.TooltipOpts(is_show=False),
        areastyle_opts=opts.AreaStyleOpts(color=JsCode(area_color_js), opacity=1),
    )
    .set_global_opts(
        title_opts=opts.TitleOpts(
            title="一周每天订单量",
            pos_top="2%",
            pos_left="center",
            title_textstyle_opts=opts.TextStyleOpts(color="#fff", font_size=16),
        ),
        xaxis_opts=opts.AxisOpts(
            type_="category",
            boundary_gap=True,
            axislabel_opts=opts.LabelOpts(margin=30, color="#ffffff63",font_weight =900),
            axisline_opts=opts.AxisLineOpts(is_show=False),
            axistick_opts=opts.AxisTickOpts(
                is_show=True,
                length=25,
                linestyle_opts=opts.LineStyleOpts(color="#ffffff1f"),
            ),
            splitline_opts=opts.SplitLineOpts(
                is_show=True, linestyle_opts=opts.LineStyleOpts(color="#ffffff1f")
            ),
        ),
        yaxis_opts=opts.AxisOpts(
            type_="value",
            position="left",
            axislabel_opts=opts.LabelOpts(margin=20, color="#ffffff63"),
            axisline_opts=opts.AxisLineOpts(
                linestyle_opts=opts.LineStyleOpts(width=2, color="#fff")
            ),
            axistick_opts=opts.AxisTickOpts(
                is_show=True,
                length=15,
                linestyle_opts=opts.LineStyleOpts(color="#ffffff1f"),
            ),
            splitline_opts=opts.SplitLineOpts(
                is_show=True, linestyle_opts=opts.LineStyleOpts(color="#ffffff1f")
            ),
        ),
        legend_opts=opts.LegendOpts(is_show=False),
    )
)
line1.render('一周每天订单量分析图.html')

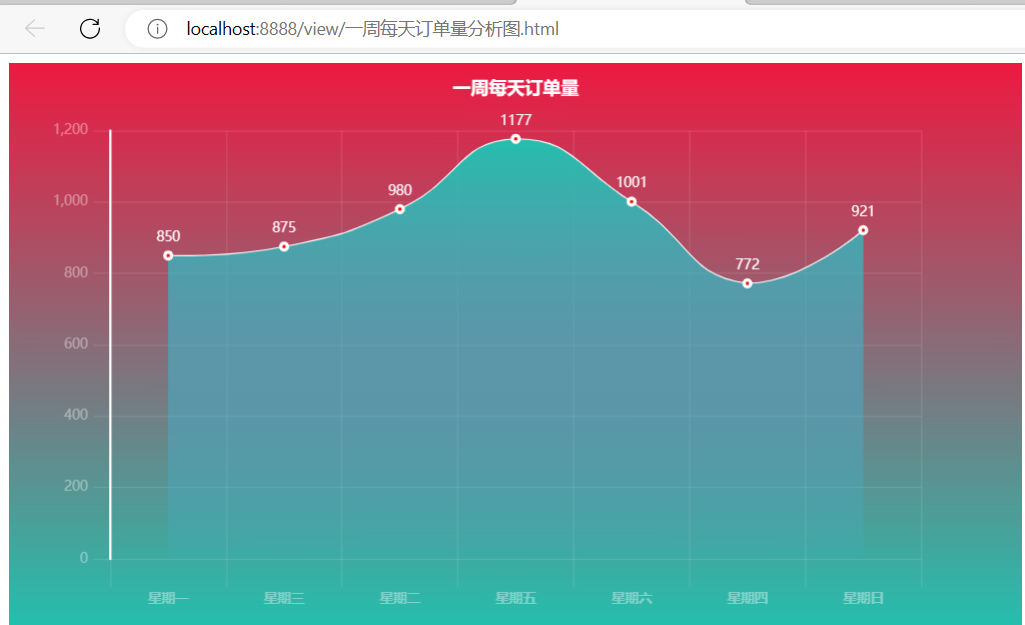
我们通过折线图来分析每周的订单数量
(5)自然月每天订单数量
# 自然月每天订单数量
df3['购药日期'] = pd.to_datetime(df3['购药日期'])
df_day = df3.groupby(df3['购药日期'].dt.day)['星期'].count()
day_x_data = [str(i) for i in list(df_day.index)]
day_y_data = df_day.values.tolist()
line1 = (
    Line(init_opts=opts.InitOpts(bg_color=JsCode(color_js)))
    .add_xaxis(xaxis_data=day_x_data)
    .add_yaxis(
        series_name="",
        y_axis=day_y_data,
        is_smooth=True,
        is_symbol_show=True,
        symbol="circle",
        symbol_size=6,
        linestyle_opts=opts.LineStyleOpts(color="#fff"),
        label_opts=opts.LabelOpts(is_show=True, position="top", color="white"),
        itemstyle_opts=opts.ItemStyleOpts(
            color="red", border_color="#fff", border_width=3
        ),
        tooltip_opts=opts.TooltipOpts(is_show=False),
        areastyle_opts=opts.AreaStyleOpts(color=JsCode(area_color_js), opacity=1),
    )
    .set_global_opts(
        title_opts=opts.TitleOpts(
            title="自然月每日订单量",
            pos_top="5%",
            pos_left="center",
            title_textstyle_opts=opts.TextStyleOpts(color="#fff", font_size=16),
        ),
        xaxis_opts=opts.AxisOpts(
            type_="category",
            boundary_gap=True,
            axislabel_opts=opts.LabelOpts(margin=30, color="#ffffff63",font_weight =900),
            axisline_opts=opts.AxisLineOpts(is_show=False),
            axistick_opts=opts.AxisTickOpts(
                is_show=True,
                length=25,
                linestyle_opts=opts.LineStyleOpts(color="#ffffff1f"),
            ),
            splitline_opts=opts.SplitLineOpts(
                is_show=True, linestyle_opts=opts.LineStyleOpts(color="#ffffff1f")
            ),
        ),
        yaxis_opts=opts.AxisOpts(
            type_="value",
            position="left",
            axislabel_opts=opts.LabelOpts(margin=20, color="#ffffff63"),
            axisline_opts=opts.AxisLineOpts(
                linestyle_opts=opts.LineStyleOpts(width=2, color="#fff")
            ),
            axistick_opts=opts.AxisTickOpts(
                is_show=True,
                length=15,
                linestyle_opts=opts.LineStyleOpts(color="#ffffff1f"),
            ),
            splitline_opts=opts.SplitLineOpts(
                is_show=True, linestyle_opts=opts.LineStyleOpts(color="#ffffff1f")
            ),
        ),
        legend_opts=opts.LegendOpts(is_show=False),
    )
)
line1.render('自然月每天订单数量分析图.html')
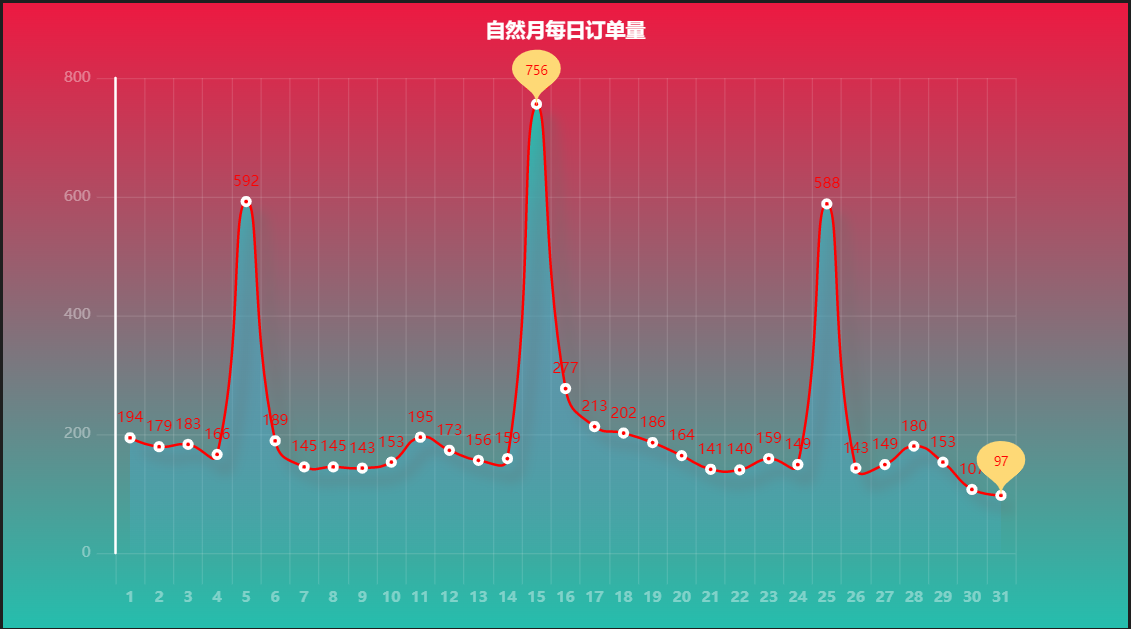
可以看出:5 日、15 日、25 日是药品销售高峰期,尤其是每月 15 日
(6)每月订单数量
# 每月订单数量
df_month = df3.groupby(df3['购药日期'].dt.month)['星期'].count()
day_x_data = [str(i)+'月' for i in list(df_month.index)]
day_y_data = df_month.values.tolist()
line1 = (
    Line(init_opts=opts.InitOpts(bg_color=JsCode(color_js)))
    .add_xaxis(xaxis_data=day_x_data)
    .add_yaxis(
        series_name="",
        y_axis=day_y_data,
        is_smooth=True,
        is_symbol_show=True,
        symbol="circle",
        symbol_size=6,
        linestyle_opts=opts.LineStyleOpts(color="#fff"),
        label_opts=opts.LabelOpts(is_show=True, position="top", color="black"),
        itemstyle_opts=opts.ItemStyleOpts(
            color="red", border_color="#fff", border_width=3
        ),
        tooltip_opts=opts.TooltipOpts(is_show=False),
        areastyle_opts=opts.AreaStyleOpts(color=JsCode(area_color_js), opacity=1),
    )
    .set_global_opts(
        title_opts=opts.TitleOpts(
            title="每月订单量",
            pos_top="2%",
            pos_left="center",
            title_textstyle_opts=opts.TextStyleOpts(color="#fff", font_size=16),
        ),
        xaxis_opts=opts.AxisOpts(
            type_="category",
            boundary_gap=True,
            axislabel_opts=opts.LabelOpts(margin=30, color="#ffffff63",font_weight =900),
            axisline_opts=opts.AxisLineOpts(is_show=False),
            axistick_opts=opts.AxisTickOpts(
                is_show=True,
                length=25,
                linestyle_opts=opts.LineStyleOpts(color="#ffffff1f"),
            ),
            splitline_opts=opts.SplitLineOpts(
                is_show=True, linestyle_opts=opts.LineStyleOpts(color="#ffffff1f")
            ),
        ),
        yaxis_opts=opts.AxisOpts(
            type_="value",
            position="left",
            axislabel_opts=opts.LabelOpts(margin=20, color="#ffffff63"),
            axisline_opts=opts.AxisLineOpts(
                linestyle_opts=opts.LineStyleOpts(width=2, color="#fff")
            ),
            axistick_opts=opts.AxisTickOpts(
                is_show=True,
                length=15,
                linestyle_opts=opts.LineStyleOpts(color="#ffffff1f"),
            ),
            splitline_opts=opts.SplitLineOpts(
                is_show=True, linestyle_opts=opts.LineStyleOpts(color="#ffffff1f")
            ),
        ),
        legend_opts=opts.LegendOpts(is_show=False),
    )
)
line1.render('每月订单数量分析图.html')
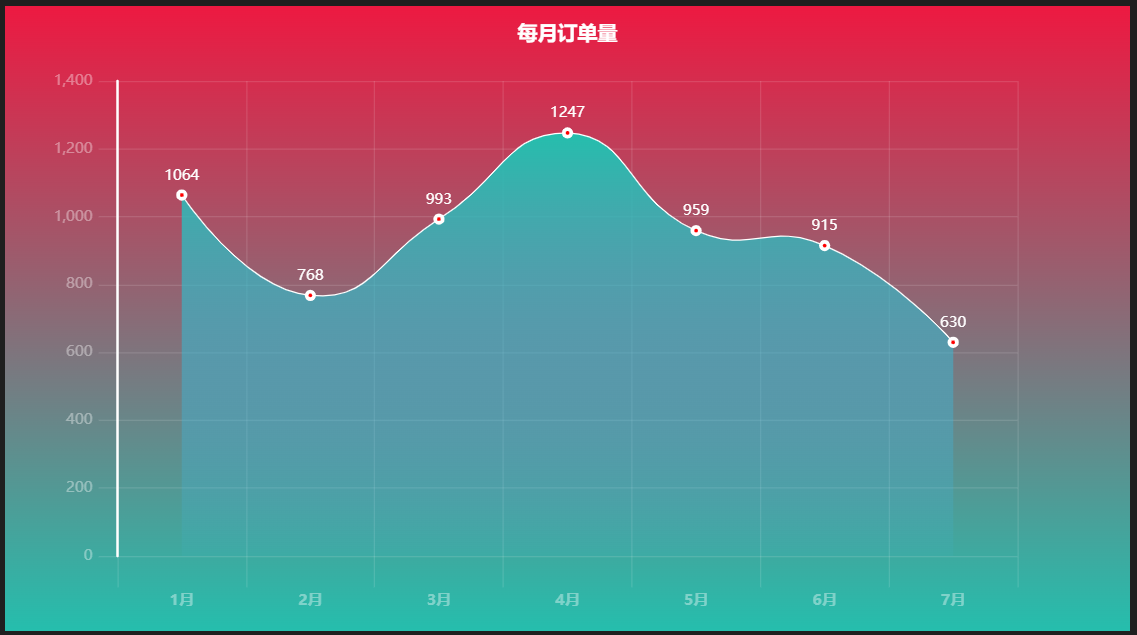
在这里我们可以发现 1 月份和 4 月份药品销售数据较其他几个月更多
(7)五月每日订单量
# 五月每日订单量
colors = ['#C9DA36','#9ECB3C','#6DBC49','#37B44E','#3DBA78','#7D3990','#A63F98','#C31C88','#F57A34','#FA8F2F','#CF7B25','#CF7B25','#FF5733','#C70039']
df_day = df3.groupby(df3['购药日期'].dt.day)['星期'].count()
day_x_data = [str(i) for i in list(df_day.index)]
day_y_data = df_day.values.tolist()
times = [x.strftime('%Y-%m-%d') for x in list(pd.date_range('20160501', '20160531'))]
data = [[times[index],day_y_data[index]] for index,item in enumerate( day_y_data)]
Cal = (
    Calendar(init_opts=opts.InitOpts(width="800px", height="500px"))
    .add(
        series_name="五月每日订单量分布情况",
        yaxis_data=data,
        calendar_opts=opts.CalendarOpts(
             pos_top='20%',
             pos_left='5%',
             range_="2016-05",
             cell_size=40,
             # 年月日标签样式设置
             daylabel_opts=opts.CalendarDayLabelOpts(name_map="cn",
      margin=20,
      label_font_size=14,
      label_color='#EB1934',
      label_font_weight='bold'
     ),
             monthlabel_opts=opts.CalendarMonthLabelOpts(name_map="cn",
          margin=20,
          label_font_size=14,
          label_color='#EB1934',
          label_font_weight='bold',
          is_show=False
         ),
             yearlabel_opts=opts.CalendarYearLabelOpts(is_show=False),
        ),
        tooltip_opts='{c}',
    )
    .set_global_opts(
        title_opts=opts.TitleOpts(
            pos_top="2%",
            pos_left="center",
            title=""
        ),
        visualmap_opts=opts.VisualMapOpts(
            orient="horizontal",
            max_=800,
            pos_bottom='10%',
            is_piecewise=True,
            pieces=[{"min": 600},
                    {"min": 300, "max": 599},
                    {"min": 200, "max": 299},
                    {"min": 160, "max": 199},
                    {"min": 100, "max": 159},
                    {"max": 99}],
            range_color=['#ffeda0','#fed976','#fd8d3c','#fc4e2a','#e31a1c','#b10026']
        ),
        legend_opts=opts.LegendOpts(is_show=True,
                                    pos_top='5%',
                                    item_width = 50,
                                    item_height = 30,
                                    textstyle_opts=opts.TextStyleOpts(font_size=16,color='#EB1934'),
                                    legend_icon ='path://path://M465.621333 469.333333l-97.813333-114.133333a21.333333 21.333333 0 1 1 32.384-27.733333L512 457.856l111.786667-130.432a21.333333 21.333333 0 1 1 32.426666 27.776L558.357333 469.333333h81.493334c11.84 0 21.461333 9.472 21.461333 21.333334 0 11.776-9.6 21.333333-21.482667 21.333333H533.333333v85.333333h106.517334c11.861333 0 21.482667 9.472 21.482666 21.333334 0 11.776-9.6 21.333333-21.482666 21.333333H533.333333v127.850667c0 11.861333-9.472 21.482667-21.333333 21.482666-11.776 0-21.333333-9.578667-21.333333-21.482666V640h-106.517334A21.354667 21.354667 0 0 1 362.666667 618.666667c0-11.776 9.6-21.333333 21.482666-21.333334H490.666667v-85.333333h-106.517334A21.354667 21.354667 0 0 1 362.666667 490.666667c0-11.776 9.6-21.333333 21.482666-21.333334h81.472zM298.666667 127.957333C298.666667 104.405333 317.824 85.333333 341.12 85.333333h341.76C706.304 85.333333 725.333333 104.490667 725.333333 127.957333v42.752A42.645333 42.645333 0 0 1 682.88 213.333333H341.12C317.696 213.333333 298.666667 194.176 298.666667 170.709333V127.957333zM341.333333 170.666667h341.333334V128H341.333333v42.666667z m-105.173333-42.666667v42.666667H170.752L170.666667 895.893333 853.333333 896V170.773333L789.909333 170.666667V128h63.296C876.842667 128 896 147.072 896 170.773333v725.12C896 919.509333 877.013333 938.666667 853.333333 938.666667H170.666667a42.666667 42.666667 0 0 1-42.666667-42.773334V170.773333C128 147.157333 147.114667 128 170.752 128h65.408z'
                                   ),
    )
)
Cal.render('五月每日订单量分析图.html')
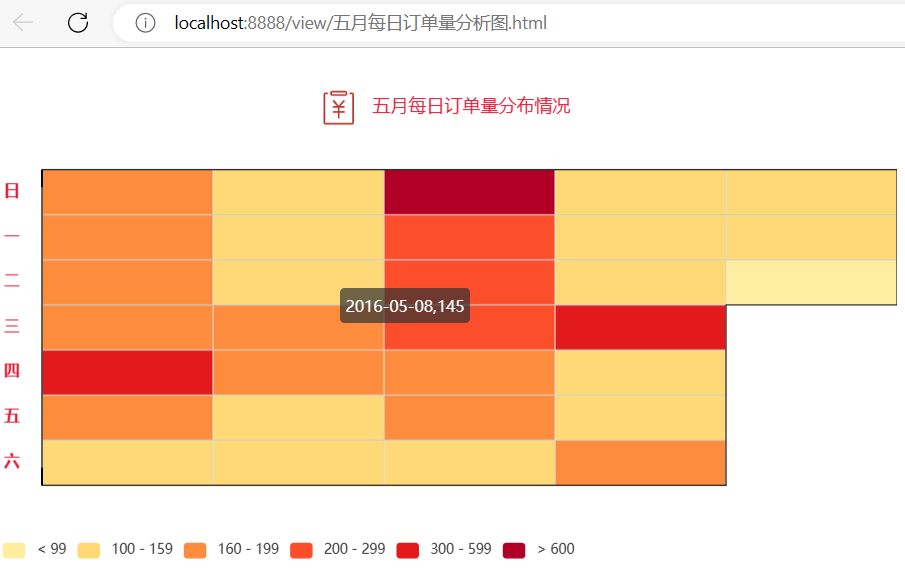
我们把五月每日订单单独拿出来分析,可以看出:苯磺酸氨氯地平片 (安内真)、开博通、酒石酸美托洛尔片 (倍他乐克) 等治疗高血压、心绞痛药物购买量比较多
(8)药品销售数据词云
# 词云
g = df3.groupby('商品名称').sum()
drug_list = []
for idx, value in enumerate(list(g.index)):
    drug_list += [value] * list(g['销售数量'].values)[idx]
stylecloud.gen_stylecloud(
    text=' '.join(drug_list),
    font_path=r'STXINWEI.TTF',
    palette='cartocolors.qualitative.Bold_5',# 设置配色方案
    icon_name='fas fa-lock', # 设置蒙版方案
#     background_color='black',
    max_font_size=200,
    output_name='药品销量.png',
    )
Image.open("药品销量.png")

4.随机森林填补缺失值
利用随机森林进行填补缺失值的思想:随机森林是进行回归的操作,我们可以把那 些包含缺失值的列当作标签,如果是很多列都有缺失值,那么就要按照每一列的缺失 值的从小到大来填补(因为这样子的话,正确率会更加高一些,因为缺失值少的那个 对特征等的要求更加低一些),然后在将剩下和原本就已经给的标签组成新的特征矩阵 (一般情况下,最开始的标签是不会有缺失值的),在这个特征矩阵里面,将缺失值利用 numpy,pandas 或者 sklearn 的 impleImputer 填补为 0,因为 0 对数据的影响比较小。接着 就是将取出的那个新的标签列,按照有没有缺失值分为 Ytrain 和 Ytest,同样的道理,按 照新标签列有缺失值所在的行的位置,将新的特征矩阵分为 Xtrain 和 Xtest,然后就可 以利用 RandomForestRegressor() 来进行训练和预测,利用 predict 接口来得到最后的 Y, 其实在前面的 Ytest 并没有用处,只是来确定所在的行而已。在这里的 predict 出来的就 是要填补的内容,将它把 Ytest 覆盖就可以了。如果有缺失值的列很多的话,就可以使 用循环,不断的预测就可以了。最后所填补的缺失值的正确率要远比利用 0 填补,均值 填补,中位数填补,最多数填补的高。
from sklearn.impute import SimpleImputer
from sklearn.ensemble import RandomForestRegressor
import numpy as np
data_copy = df.copy()
data_copy.drop(data_copy.columns[0], axis=1, inplace=True)
sindex = np.argsort(data_copy.isnull().sum()).values
# 进行缺失值的填补,利用随机森林进行填补缺失值
for i in sindex :
    if data_copy.iloc[:,i].isnull().sum() == 0 :
        continue
    df = data_copy
    fillc = df.iloc[:, i]
    df = df.iloc[:,df.columns!=df.columns[i]]
#在下面的是使用了0来对特征矩阵中的缺失值的填补,
    df_0 = SimpleImputer(missing_values=np.nan
                        ,strategy="constant"
                        ,fill_value=0
                        ).fit_transform(df)
    Ytrain = fillc[fillc.notnull()]
    Ytest = fillc[fillc.isnull()]
    Xtrain = df_0[Ytrain.index,:]
    Xtest = df_0[Ytest.index,:]
    rfc = RandomForestRegressor()
    rfc.fit(Xtrain, Ytrain)
    Ypredict = rfc.predict(Xtest)
    data_copy.loc[data_copy.iloc[:,i].isnull(),data_copy.columns[i]] = Ypredict
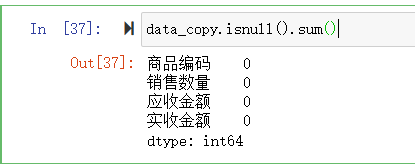
data_copy.isnull().sum()
5完整代码附上
import pandas as pd
import stylecloud
from sklearn.impute import SimpleImputer
from sklearn.ensemble import RandomForestRegressor
import numpy as np
from PIL import Image
from collections import Counter
from pyecharts.charts import Bar
from pyecharts.charts import Line
from pyecharts.charts import Calendar
from pyecharts import options as opts
from pyecharts.commons.utils import JsCode
from pyecharts.globals import SymbolType
df = pd.read_excel('电商平台药品销售数据.xlsx')
df.head(10)
from sklearn.impute import SimpleImputer
import numpy as np
# 取出缺失值所在列的数值,sklearn当中特征矩阵必须是二维才能传入 使用reshape(-1,1)升维
sums=df['实收金额'].values.reshape(-1,1)
# 按平均值填充
imp_mean = SimpleImputer(missing_values=np.nan, strategy='mean')
imp_mean=imp_mean.fit_transform(sums)
df['实收金额']=imp_mean
df
df.info()
df.shape
df.isnull().sum()
df[df.isnull().T.any()]
df1 = df.copy()
df1 = df1.dropna(subset=['购药时间'])
df1[df1.isnull().T.any()]
df1['社保卡号'].fillna('0000', inplace=True)
df1.isnull().sum()
df1['社保卡号'] = df1['社保卡号'].astype(str)
df1['商品编码'] = df1['商品编码'].astype(str)
df1['销售数量'] = df1['销售数量'].astype(int)
df1.info()
df1.head()
df_tmp = pd.read_excel('电商平台药品销售数据.xlsx', converters={'社保卡号':str, '商品编码':str, '销售数量':int})
df_tmp.head()
df2 = df_tmp.copy()
df2 = df2.dropna(subset=['购药时间'])
df2['社保卡号'].fillna('0000', inplace=True)
df2['销售数量'] = df2['销售数量'].astype(int)
df2[['销售数量','应收金额','实收金额']].describe()
df2.loc[(df2['销售数量'] < 0)]
df2['销售数量'] = df2['销售数量'].abs()
df2['应收金额'] = df2['应收金额'].abs()
df2['实收金额'] = df2['实收金额'].abs()
df2.loc[(df2['销售数量'] < 0) | (df2['应收金额'] < 0) | (df2['实收金额'] < 0)].sum()
df3 = df2.copy()
df3[['购药日期', '星期']] = df3['购药时间'].str.split(' ', 2, expand = True)
df3 = df3[['购药日期', '星期','社保卡号','商品编码', '商品名称', '销售数量', '应收金额', '实收金额' ]]
df3
len(df3['购药日期'].unique())
df3.groupby('购药日期').sum()
color_js = """new echarts.graphic.LinearGradient(0, 1, 0, 0,
    [{offset: 0, color: '#FFFFFF'}, {offset: 1, color: '#ed1941'}], false)"""
g1 = df3.groupby('星期').sum()
x_data = list(g1.index)
y_data = g1['销售数量'].values.tolist()
b1 = (
        Bar()
        .add_xaxis(x_data)
        .add_yaxis('',y_data ,itemstyle_opts=opts.ItemStyleOpts(color=JsCode(color_js)))
        .set_global_opts(title_opts=opts.TitleOpts(title='一周各天药品销量',pos_top='2%',pos_left = 'center'),
            legend_opts=opts.LegendOpts(is_show=False),
            xaxis_opts=opts.AxisOpts(axislabel_opts=opts.LabelOpts(rotate=-15)),
            yaxis_opts=opts.AxisOpts(name="销量",name_location='middle',name_gap=50,name_textstyle_opts=opts.TextStyleOpts(font_size=16)))
    )
b1.render('一周各天药品销量柱状图.html')
color_js = """new echarts.graphic.LinearGradient(0, 1, 0, 0,
    [{offset: 0, color: '#FFFFFF'}, {offset: 1, color: '#08519c'}], false)"""
g2 = df3.groupby('商品名称').sum().sort_values(by='销售数量', ascending=False)
x_data = list(g2.index)[:10]
y_data = g2['销售数量'].values.tolist()[:10]
b2 = (
        Bar()
        .add_xaxis(x_data)
        .add_yaxis('',y_data ,itemstyle_opts=opts.ItemStyleOpts(color=JsCode(color_js)))
        .set_global_opts(title_opts=opts.TitleOpts(title='药品销量前十',pos_top='2%',pos_left = 'center'),
            legend_opts=opts.LegendOpts(is_show=False),
            xaxis_opts=opts.AxisOpts(axislabel_opts=opts.LabelOpts(rotate=-15)),
            yaxis_opts=opts.AxisOpts(name="销量",name_location='middle',name_gap=50,name_textstyle_opts=opts.TextStyleOpts(font_size=16)))
    )
b2.render('药品销量前十柱状图改.html')
# 设置样式
color_js = """new echarts.graphic.LinearGradient(0, 1, 0, 0,
    [{offset: 0, color: '#25BEAD'}, {offset: 1, color: '#ed1941'}], false)"""
area_color_js = (
    "new echarts.graphic.LinearGradient(0, 0, 0, 1, "
    "[{offset: 0, color: '#25BEAD'}, {offset: 1, color: '#3fbbff0d'}], false)"
)
# 一周每天订单量
df_week = df3.groupby(['星期'])['实收金额'].count()
week_x_data = df_week.index
week_y_data = df_week.values.tolist()
line1 = (
    Line(init_opts=opts.InitOpts(bg_color=JsCode(color_js)))
    .add_xaxis(xaxis_data=week_x_data)
    .add_yaxis(
        series_name="",
        y_axis=week_y_data,
        is_smooth=True,
        is_symbol_show=True,
        symbol="circle",
        symbol_size=6,
        linestyle_opts=opts.LineStyleOpts(color="#fff"),
        label_opts=opts.LabelOpts(is_show=True, position="top", color="white"),
        itemstyle_opts=opts.ItemStyleOpts(
            color="red", border_color="#fff", border_width=3
        ),
        tooltip_opts=opts.TooltipOpts(is_show=False),
        areastyle_opts=opts.AreaStyleOpts(color=JsCode(area_color_js), opacity=1),
    )
    .set_global_opts(
        title_opts=opts.TitleOpts(
            title="一周每天订单量",
            pos_top="2%",
            pos_left="center",
            title_textstyle_opts=opts.TextStyleOpts(color="#fff", font_size=16),
        ),
        xaxis_opts=opts.AxisOpts(
            type_="category",
            boundary_gap=True,
            axislabel_opts=opts.LabelOpts(margin=30, color="#ffffff63",font_weight =900),
            axisline_opts=opts.AxisLineOpts(is_show=False),
            axistick_opts=opts.AxisTickOpts(
                is_show=True,
                length=25,
                linestyle_opts=opts.LineStyleOpts(color="#ffffff1f"),
            ),
            splitline_opts=opts.SplitLineOpts(
                is_show=True, linestyle_opts=opts.LineStyleOpts(color="#ffffff1f")
            ),
        ),
        yaxis_opts=opts.AxisOpts(
            type_="value",
            position="left",
            axislabel_opts=opts.LabelOpts(margin=20, color="#ffffff63"),
            axisline_opts=opts.AxisLineOpts(
                linestyle_opts=opts.LineStyleOpts(width=2, color="#fff")
            ),
            axistick_opts=opts.AxisTickOpts(
                is_show=True,
                length=15,
                linestyle_opts=opts.LineStyleOpts(color="#ffffff1f"),
            ),
            splitline_opts=opts.SplitLineOpts(
                is_show=True, linestyle_opts=opts.LineStyleOpts(color="#ffffff1f")
            ),
        ),
        legend_opts=opts.LegendOpts(is_show=False),
    )
)
line1.render('一周每天订单量分析图.html')
# 每月订单数量
df_month = df3.groupby(df3['购药日期'].dt.month)['星期'].count()
day_x_data = [str(i)+'月' for i in list(df_month.index)]
day_y_data = df_month.values.tolist()
line1 = (
    Line(init_opts=opts.InitOpts(bg_color=JsCode(color_js)))
    .add_xaxis(xaxis_data=day_x_data)
    .add_yaxis(
        series_name="",
        y_axis=day_y_data,
        is_smooth=True,
        is_symbol_show=True,
        symbol="circle",
        symbol_size=6,
        linestyle_opts=opts.LineStyleOpts(color="#fff"),
        label_opts=opts.LabelOpts(is_show=True, position="top", color="black"),
        itemstyle_opts=opts.ItemStyleOpts(
            color="red", border_color="#fff", border_width=3
        ),
        tooltip_opts=opts.TooltipOpts(is_show=False),
        areastyle_opts=opts.AreaStyleOpts(color=JsCode(area_color_js), opacity=1),
    )
    .set_global_opts(
        title_opts=opts.TitleOpts(
            title="每月订单量",
            pos_top="2%",
            pos_left="center",
            title_textstyle_opts=opts.TextStyleOpts(color="#fff", font_size=16),
        ),
        xaxis_opts=opts.AxisOpts(
            type_="category",
            boundary_gap=True,
            axislabel_opts=opts.LabelOpts(margin=30, color="#ffffff63",font_weight =900),
            axisline_opts=opts.AxisLineOpts(is_show=False),
            axistick_opts=opts.AxisTickOpts(
                is_show=True,
                length=25,
                linestyle_opts=opts.LineStyleOpts(color="#ffffff1f"),
            ),
            splitline_opts=opts.SplitLineOpts(
                is_show=True, linestyle_opts=opts.LineStyleOpts(color="#ffffff1f")
            ),
        ),
        yaxis_opts=opts.AxisOpts(
            type_="value",
            position="left",
            axislabel_opts=opts.LabelOpts(margin=20, color="#ffffff63"),
            axisline_opts=opts.AxisLineOpts(
                linestyle_opts=opts.LineStyleOpts(width=2, color="#fff")
            ),
            axistick_opts=opts.AxisTickOpts(
                is_show=True,
                length=15,
                linestyle_opts=opts.LineStyleOpts(color="#ffffff1f"),
            ),
            splitline_opts=opts.SplitLineOpts(
                is_show=True, linestyle_opts=opts.LineStyleOpts(color="#ffffff1f")
            ),
        ),
        legend_opts=opts.LegendOpts(is_show=False),
    )
)
line1.render('每月订单数量分析图.html')
# 五月每日订单量
colors = ['#C9DA36','#9ECB3C','#6DBC49','#37B44E','#3DBA78','#7D3990','#A63F98','#C31C88','#F57A34','#FA8F2F','#CF7B25','#CF7B25','#FF5733','#C70039']
df_day = df3.groupby(df3['购药日期'].dt.day)['星期'].count()
day_x_data = [str(i) for i in list(df_day.index)]
day_y_data = df_day.values.tolist()
times = [x.strftime('%Y-%m-%d') for x in list(pd.date_range('20160501', '20160531'))]
data = [[times[index],day_y_data[index]] for index,item in enumerate( day_y_data)]
Cal = (
    Calendar(init_opts=opts.InitOpts(width="800px", height="500px"))
    .add(
        series_name="五月每日订单量分布情况",
        yaxis_data=data,
        calendar_opts=opts.CalendarOpts(
             pos_top='20%',
             pos_left='5%',
             range_="2016-05",
             cell_size=40,
             # 年月日标签样式设置
             daylabel_opts=opts.CalendarDayLabelOpts(name_map="cn",
      margin=20,
      label_font_size=14,
      label_color='#EB1934',
      label_font_weight='bold'
     ),
             monthlabel_opts=opts.CalendarMonthLabelOpts(name_map="cn",
          margin=20,
          label_font_size=14,
          label_color='#EB1934',
          label_font_weight='bold',
          is_show=False
         ),
             yearlabel_opts=opts.CalendarYearLabelOpts(is_show=False),
        ),
        tooltip_opts='{c}',
    )
    .set_global_opts(
        title_opts=opts.TitleOpts(
            pos_top="2%",
            pos_left="center",
            title=""
        ),
        visualmap_opts=opts.VisualMapOpts(
            orient="horizontal",
            max_=800,
            pos_bottom='10%',
            is_piecewise=True,
            pieces=[{"min": 600},
                    {"min": 300, "max": 599},
                    {"min": 200, "max": 299},
                    {"min": 160, "max": 199},
                    {"min": 100, "max": 159},
                    {"max": 99}],
            range_color=['#ffeda0','#fed976','#fd8d3c','#fc4e2a','#e31a1c','#b10026']
        ),
        legend_opts=opts.LegendOpts(is_show=True,
                                    pos_top='5%',
                                    item_width = 50,
                                    item_height = 30,
                                    textstyle_opts=opts.TextStyleOpts(font_size=16,color='#EB1934'),
                                    legend_icon ='path://path://M465.621333 469.333333l-97.813333-114.133333a21.333333 21.333333 0 1 1 32.384-27.733333L512 457.856l111.786667-130.432a21.333333 21.333333 0 1 1 32.426666 27.776L558.357333 469.333333h81.493334c11.84 0 21.461333 9.472 21.461333 21.333334 0 11.776-9.6 21.333333-21.482667 21.333333H533.333333v85.333333h106.517334c11.861333 0 21.482667 9.472 21.482666 21.333334 0 11.776-9.6 21.333333-21.482666 21.333333H533.333333v127.850667c0 11.861333-9.472 21.482667-21.333333 21.482666-11.776 0-21.333333-9.578667-21.333333-21.482666V640h-106.517334A21.354667 21.354667 0 0 1 362.666667 618.666667c0-11.776 9.6-21.333333 21.482666-21.333334H490.666667v-85.333333h-106.517334A21.354667 21.354667 0 0 1 362.666667 490.666667c0-11.776 9.6-21.333333 21.482666-21.333334h81.472zM298.666667 127.957333C298.666667 104.405333 317.824 85.333333 341.12 85.333333h341.76C706.304 85.333333 725.333333 104.490667 725.333333 127.957333v42.752A42.645333 42.645333 0 0 1 682.88 213.333333H341.12C317.696 213.333333 298.666667 194.176 298.666667 170.709333V127.957333zM341.333333 170.666667h341.333334V128H341.333333v42.666667z m-105.173333-42.666667v42.666667H170.752L170.666667 895.893333 853.333333 896V170.773333L789.909333 170.666667V128h63.296C876.842667 128 896 147.072 896 170.773333v725.12C896 919.509333 877.013333 938.666667 853.333333 938.666667H170.666667a42.666667 42.666667 0 0 1-42.666667-42.773334V170.773333C128 147.157333 147.114667 128 170.752 128h65.408z'
                                   ),
    )
)
Cal.render('五月每日订单量分析图.html')
# 词云
g = df3.groupby('商品名称').sum()
drug_list = []
for idx, value in enumerate(list(g.index)):
    drug_list += [value] * list(g['销售数量'].values)[idx]
stylecloud.gen_stylecloud(
    text=' '.join(drug_list),
    font_path=r'STXINWEI.TTF',
    palette='cartocolors.qualitative.Bold_5',# 设置配色方案
    icon_name='fas fa-lock', # 设置蒙版方案
#     background_color='black',
    max_font_size=200,
    output_name='药品销量.png',
    )
Image.open("药品销量.png")
data_copy = df.copy()
data_copy.drop(data_copy.columns[0], axis=1, inplace=True)
sindex = np.argsort(data_copy.isnull().sum()).values
# 进行缺失值的填补,利用随机森林进行填补缺失值
for i in sindex :
    if data_copy.iloc[:,i].isnull().sum() == 0 :
        continue
    df = data_copy
    fillc = df.iloc[:, i]
    df = df.iloc[:,df.columns!=df.columns[i]]
#在下面的是使用了0来对特征矩阵中的缺失值的填补,
    df_0 = SimpleImputer(missing_values=np.nan
                        ,strategy="constant"
                        ,fill_value=0
                        ).fit_transform(df)
    Ytrain = fillc[fillc.notnull()]
    Ytest = fillc[fillc.isnull()]
    Xtrain = df_0[Ytrain.index,:]
    Xtest = df_0[Ytest.index,:]
    rfc = RandomForestRegressor()
    rfc.fit(Xtrain, Ytrain)
    Ypredict = rfc.predict(Xtest)
    data_copy.loc[data_copy.iloc[:,i].isnull(),data_copy.columns[i]] = Ypredict
data_copy.isnull().sum()
四、总结
在进行药品销售数量的大数据分析时,我通过对数据的分析和挖掘,得出了以下有益的结论:通过对销售数据的时间序列分析,我发现药品销售数量存在季节性波动,在春季和秋季销售数量通常较高,在夏季和冬季销售数量通常较低。在完成此设计过程中,我得到了许多收获。首先,我学会了如何进行大数据分析,包括如何清洗数据、如何使用数据分析工具进行数据分析和可视化。其次,我还学会了如何根据分析结果得出有益的结论并提出建议。在未来的工作中,我建议对数据进行更深入的分析,例如通过进行回归分析来更准确地预测药品销售数量的变化趋势,并进一步优化药品销售策略。此外,我还建议对数据进行实时更新,以便更好地反映市场变化并进行及时调整。
猜你喜欢
网友评论
- 搜索
- 最新文章
- 热门文章
