数据分析与数据挖掘实战案例(7/16):
2022 年首届钉钉杯大学生大数据挑战赛练习题目 练习题 A:二手房房价分析与预测
要点:
1、机器学习
2、数据挖掘
3、数据清洗、分析、pyeahcrs可视化
4、随机森林回归预测模型预测房价
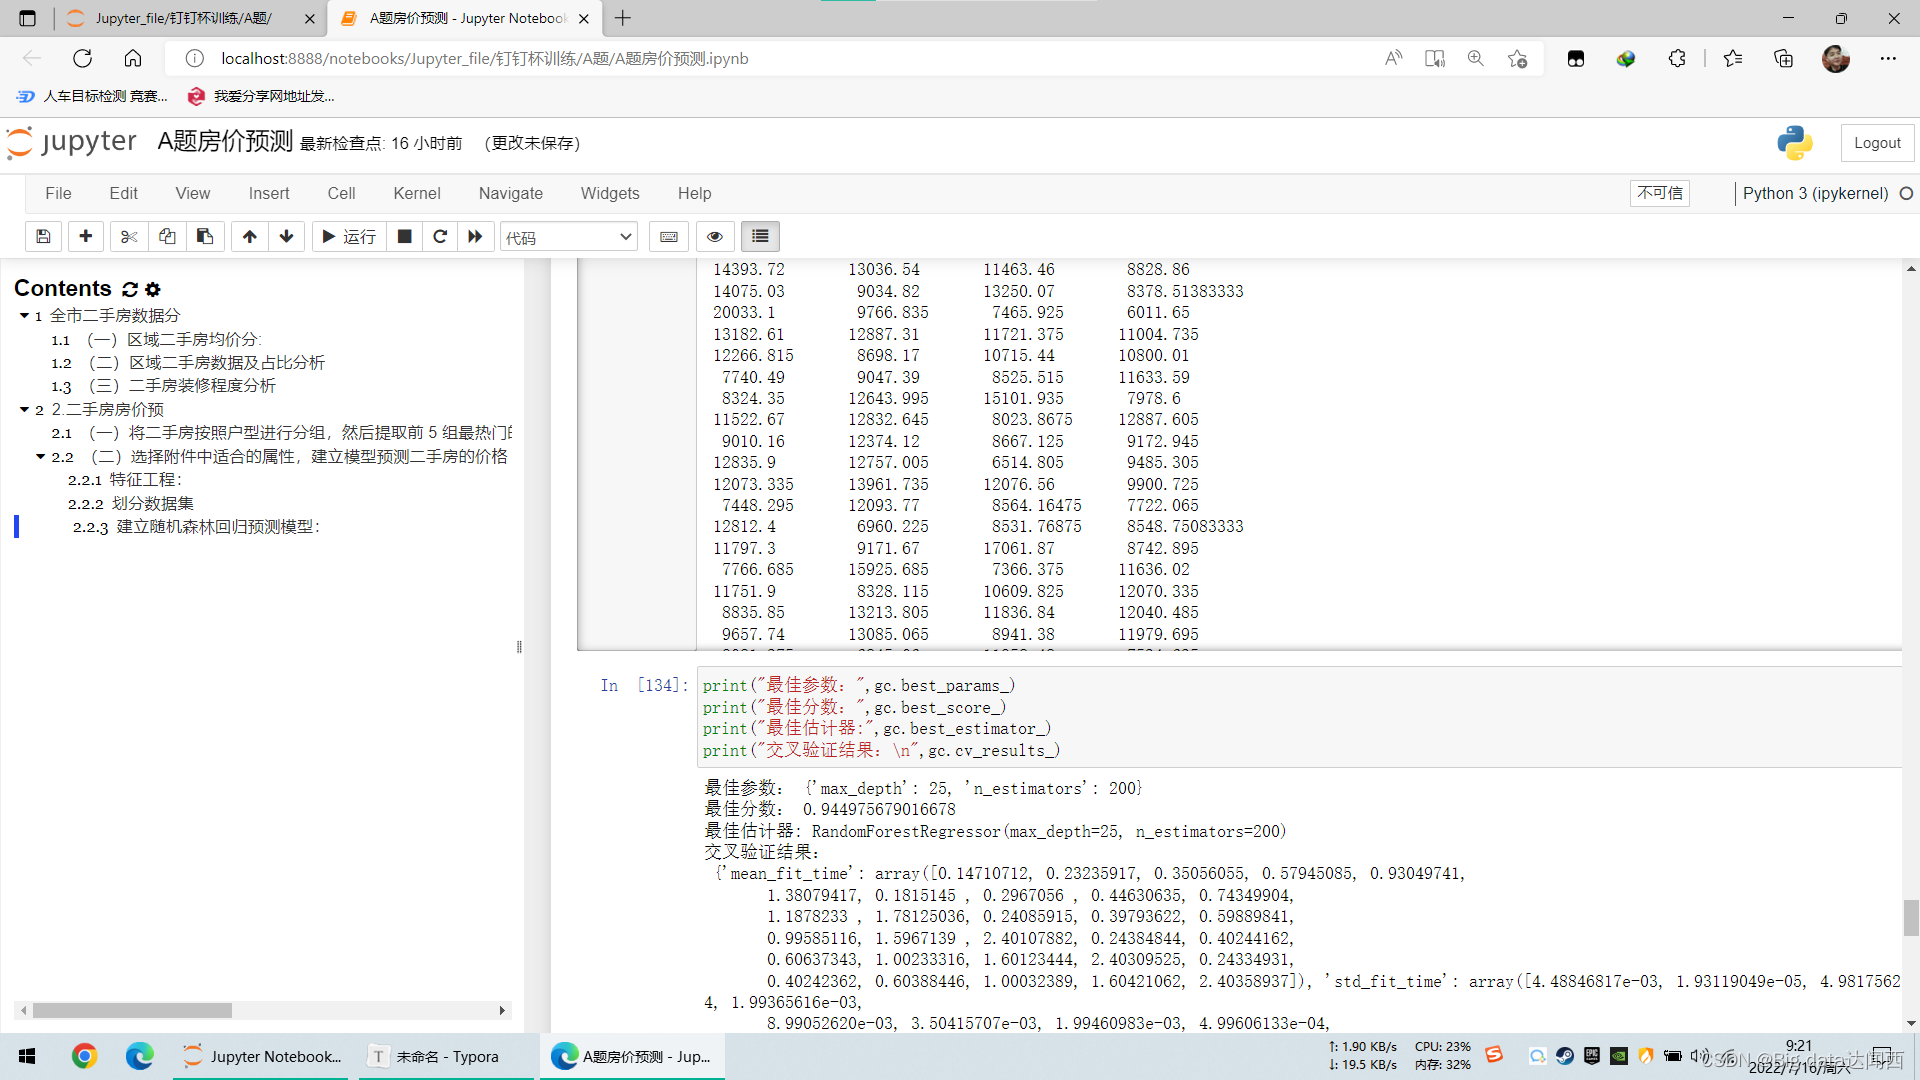
整体代码:
过程代码:
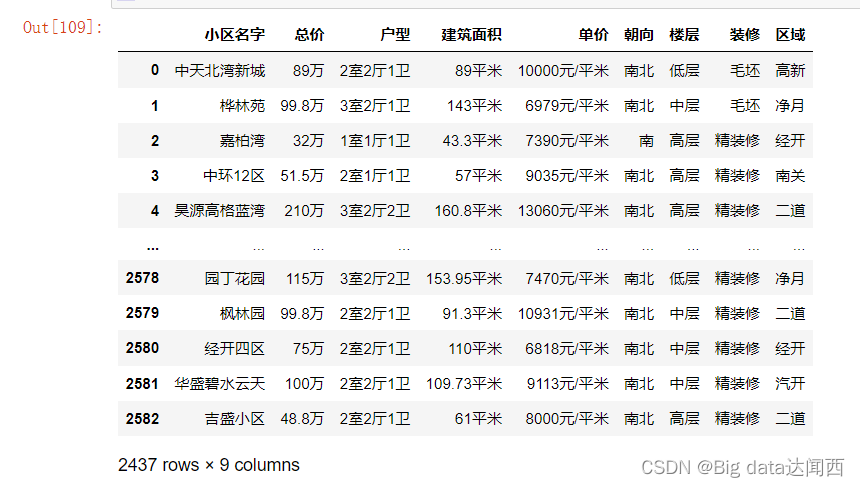
1、读入数据、清洗数据:
import pandas as pd
import numpy as np
df=pd.read_csv("data.csv",encoding='utf-8')  #文件路径为绝对路径,根据自己电脑文件夹的路径修改
df
df.info() #查看df信息
df.dropna(inplace=True) #删除空值行
df.drop('Unnamed: 0',axis=1,inplace=True)  #删除无用列
df
df=df.drop_duplicates()  ###消除重复记录
df
2、解决相关问题:
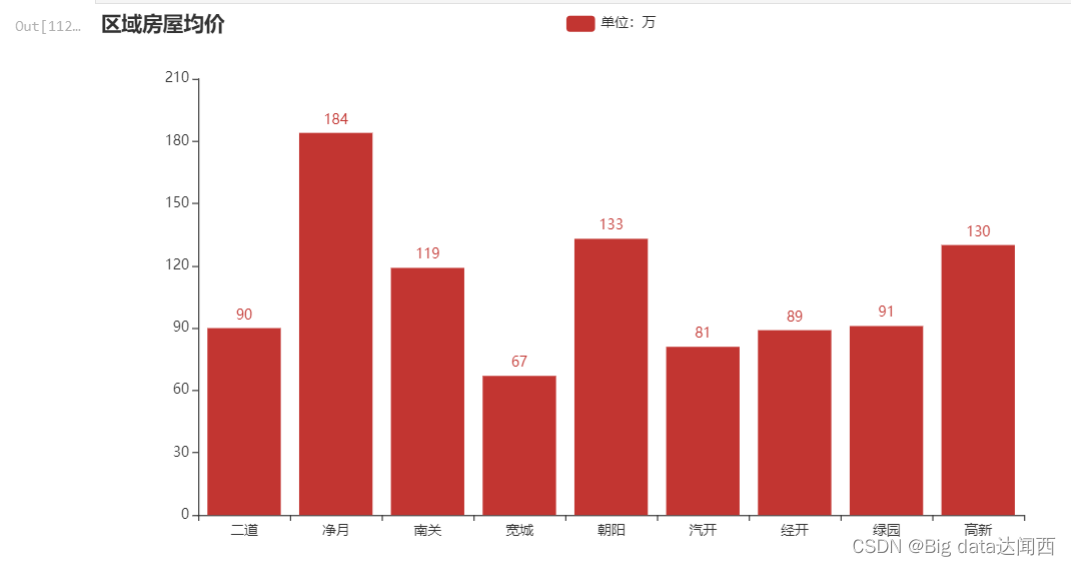
(一) 根据附件中的数据集,将二手房数据按照“区域”属性进行划分,然后计算每个 区域的二手房均价,最后将区域及对应的房屋均价信息通过纵向条形图显示 :
import re
zonjia = []
for v in df['总价']:
    a = re.findall(r'\d+',str(v))[0]
#     print(a)
    zonjia.append(int(a))
df['总价1'] = zonjia
df   #得到数字类型的总价1
df1_1 = df[['区域','总价1']].groupby('区域').mean()
df1_1.columns = ['区域均价']
df1_1['区域均价']  = df1_1['区域均价'].astype(int)
df1_1
#画图:
from pyecharts.charts import Bar
from pyecharts import options as opts
%matplotlib inline
bar = Bar()
bar.add_xaxis(list(df1_1.index))
bar.add_yaxis("单位:万", list(df1_1['区域均价']))
bar.set_global_opts(title_opts=opts.TitleOpts(title="区域房屋均价"))
bar.render_notebook()
# bar.render()  #生成html
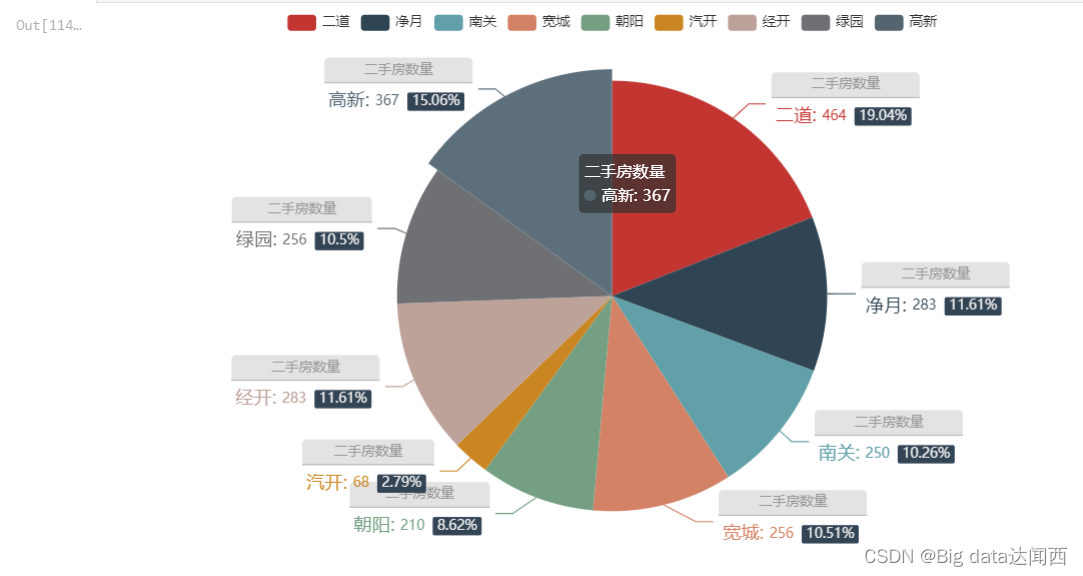
(二) 根据附件的数据集,计算各个区域二手房数量占总二手房数量的百分比,并画出 饼状图 :
df['计数'] =1
df1_2 = df[['区域','计数']].groupby('区域').count()
df1_2  #得到统计数据的dataform表格
#画图:
from pyecharts.charts import Pie
from pyecharts import options as opts
# 富文本
rich_text = {
    "a": {"color": "#999", "lineHeight": 22, "align": "center"},
    "abg": {
        "backgroundColor": "#e3e3e3",
        "width": "100%",
        "align": "right",
        "height": 22,
        "borderRadius": [4, 4, 0, 0],
    },
    "hr": {
        "borderColor": "#aaa",
        "width": "100%",
        "borderWidth": 0.5,
        "height": 0,
    },
    "b": {"fontSize": 16, "lineHeight": 33},
    "per": {
        "color": "#eee",
        "backgroundColor": "#334455",
        "padding": [2, 4],
        "borderRadius": 2,
    },
}
# 虚假数据
cate = list(df1_2.index)
data = list(df1_2['计数'])
pie = (Pie()
       .add('二手房数量', [list(z) for z in zip(cate, data)],
       label_opts=opts.LabelOpts(position='outsiede',
                     formatter="{a|{a}}{abg|}\n{hr|}\n {b|{b}: }{c}  {per|{d}%}  ",
                     rich=rich_text))
       )
pie.render_notebook()
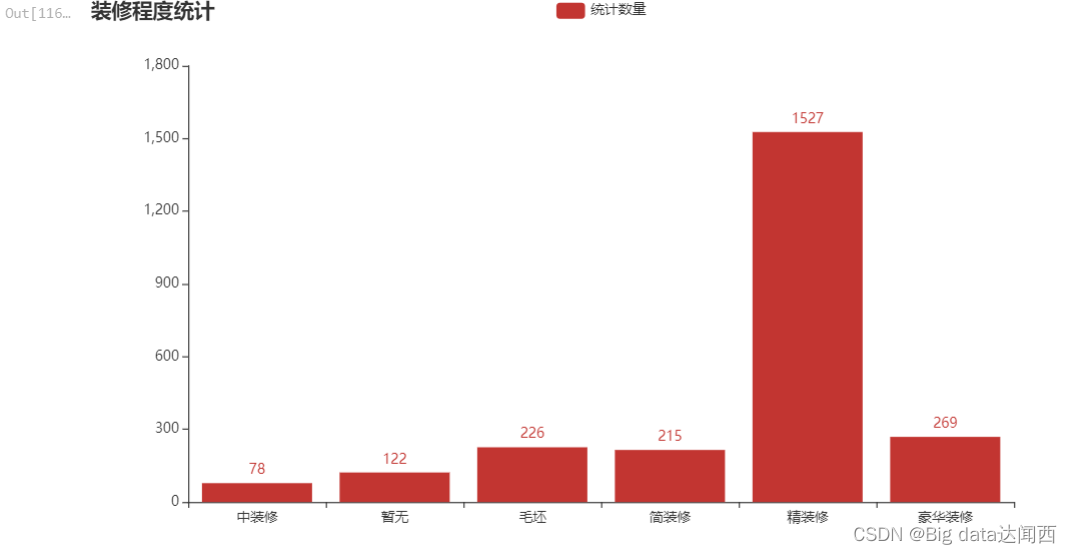
(三) 将二手房按照“装修”属性进行划分,然后计算不同装修程度的二手房数量,并 用条形图显示不同装修程度二手房的数量。 :
df1_3 = df[['装修','计数']].groupby('装修').count()
df1_3
from pyecharts.charts import Bar
from pyecharts import options as opts
%matplotlib inline
bar = Bar()
bar.add_xaxis(list(df1_3.index))
bar.add_yaxis("统计数量", list(df1_3['计数']))
bar.set_global_opts(title_opts=opts.TitleOpts(title="装修程度统计"))
bar.render_notebook()
# bar.render()  #生成html
3、机器学习随机森林建模预测房价:
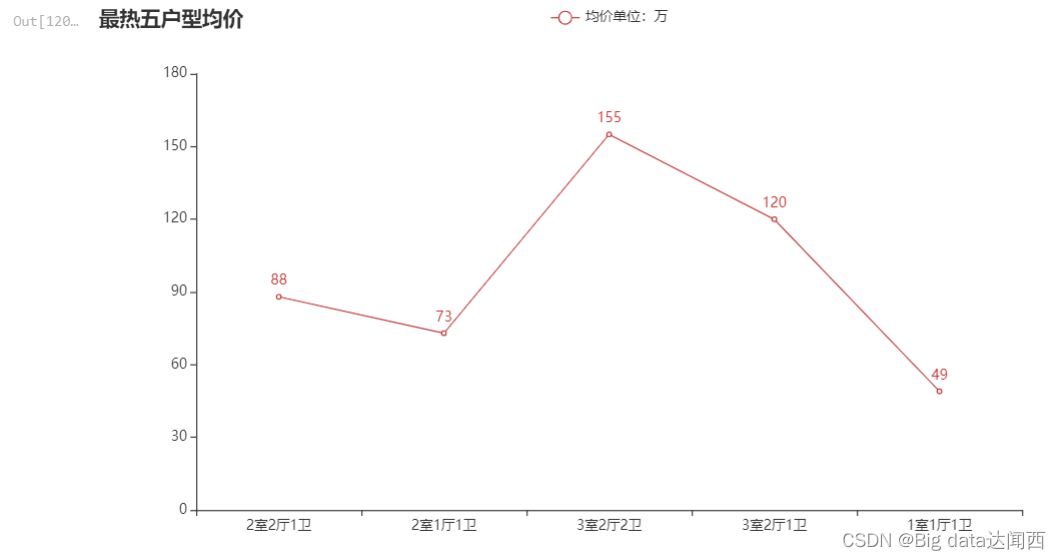
(一)将二手房按照户型进行分组,然后提取前 5 组最热门的二手房户型(出售数量最多的 5 组户型),最后计算这 5 个热门户型的均价并画图显示。
df2_1 = df[['户型','计数']].groupby('户型').count()
df2_1
df2_1.sort_values(by='计数',axis=0,ascending=False,inplace=True)
df2_1
names = list(df2_1.index[0:5])
names
df2_1_1 = df[['户型','总价1']].groupby('户型').mean()
df2_1_1
datas = []
for v in names:
    datas.append(int(df2_1_1.loc[v]))
datas
from pyecharts import options as opts
from pyecharts.charts import Bar,Line,Grid
B = ["草莓","芒果","葡萄","雪梨","西瓜","柠檬","车厘子"]
CB = [78,95,120,102,88,108,98]
line = Line()
line.add_xaxis(names)
line.add_yaxis("均价单位:万",datas)
line.set_global_opts(title_opts=opts.TitleOpts(title="最热五户型均价"),
                    legend_opts=opts.LegendOpts())
line.render_notebook()
(二)选择附件中适合的属性,建立模型预测二手房的价格
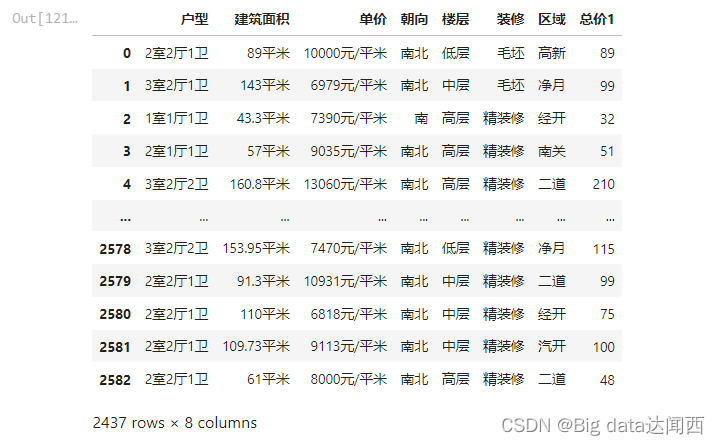
特征工程:(提取出数字数据, 拆分数据、特征编码等:)
df2 = df.drop(['小区名字','计数','总价'],axis=1)   #删除明显无关的特征列
df2
# 字符型数据和离散型数据转为数字特征:
df2['建筑面积1'] = df2['建筑面积'].str[:-2]
df2
df2['单价1'] = df2['单价'].str[:-4]
df2
shi = []
ting = []
wei = []
for v in df2['户型']:
    re_ = re.findall(r'\d+',v)
#     print(re_)
    if len(re_) >=3:
        shi.append(re_[0])
        ting.append(re_[1])
        wei.append(re_[2])
    else:
        shi.append(0)
        ting.append(0)
        wei.append(0)

df2['室'] = shi
df2['厅'] =ting
df2['卫'] =wei
df2
df2 = df2.drop(['户型','建筑面积','单价'],axis=1)  #删除无用的列
df2
df2 = df2.drop(['户型','建筑面积','单价'],axis=1)  #删除无用的列
df2
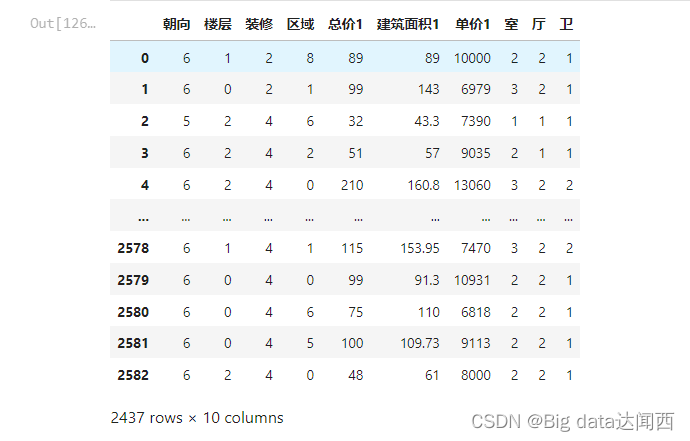
# 将字符标签或者类别数字化
df2['朝向'] = pd.Categorical(df2['朝向']).codes
df2
df2['楼层'] = pd.Categorical(df2['楼层']).codes
df2['装修'] = pd.Categorical(df2['装修']).codes
df2['区域'] = pd.Categorical(df2['区域']).codes
df2
建模:
y=df2.iloc[:,-4]  #目标列
y
x=df2.drop('单价1',axis=1)
x #特征列数据
#划分数据集:
from sklearn.model_selection import train_test_split
x_train,x_test,y_train,y_test = train_test_split(x,y,
  test_size=0.30,
  random_state=100,

     )
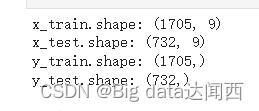
# 显示训练集和测试集的维度
print("x_train.shape:",x_train.shape)
print("x_test.shape:",x_test.shape)
print("y_train.shape:",y_train.shape)
print('y_test.shape:',y_test.shape)
from sklearn.ensemble import RandomForestRegressor
from sklearn.model_selection import GridSearchCV
# 随机森林去进行预测
rf = RandomForestRegressor()
#设置网格超参数
param = {"n_estimators": [120,200,300,500,800,1200], "max_depth": [5, 8, 15, 25, 30]}
# 超参数调优
gc = GridSearchCV(rf, param_grid=param, cv=2)   #网格搜索与交叉验证
gc.fit(x_train, y_train)
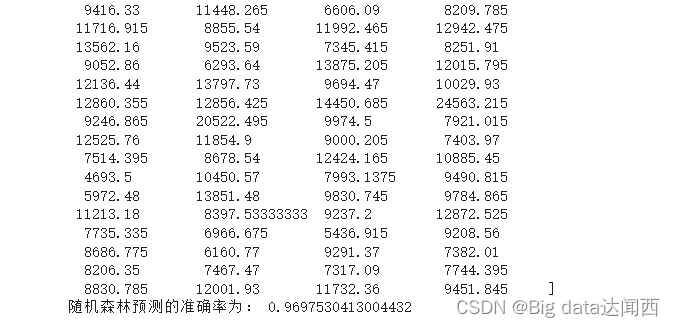
y_pre=gc.predict(x_test)
print(y_pre)#输出预测值
print("随机森林预测的准确率为:", gc.score(x_test, y_test))   #会运行一段时间
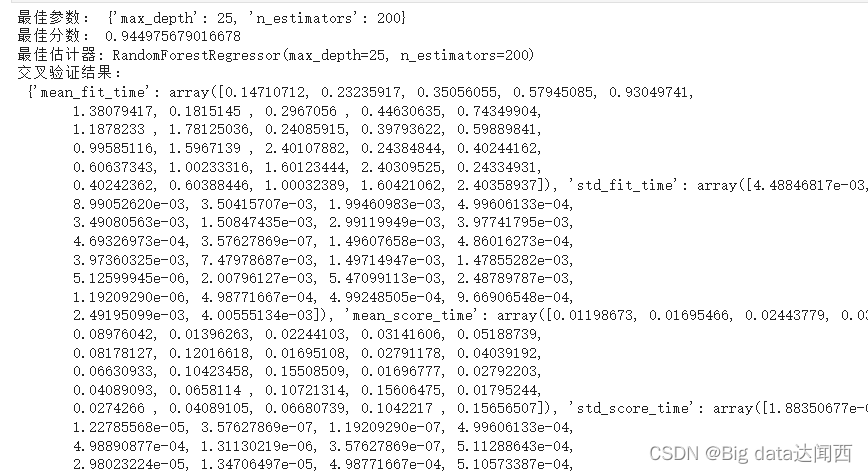
print("最佳参数:",gc.best_params_)
print("最佳分数:",gc.best_score_)
print("最佳估计器:",gc.best_estimator_)
print("交叉验证结果:\n",gc.cv_results_)
最后(源码):
这样一个简单的数据挖掘实践案例就做好了,我还有很多平时积累的案例,后续我会持续编写分享的,如果您觉得有一定的意义,请点个关注呗,您的支持是我创作的最大动力,如果需要源码:
链接:https://pan.baidu.com/s/1BIXUNwOrSEydEskuOB-_6g
提取码:8848

猜你喜欢
网友评论
- 搜索
- 最新文章
- 热门文章
