MATLAB Fundamentals>Common Data Analysis Techniques>Smoothing Data> (3/5) Smoothing Electricity Data
数据准备:This code sets up the activity.
load electricityData
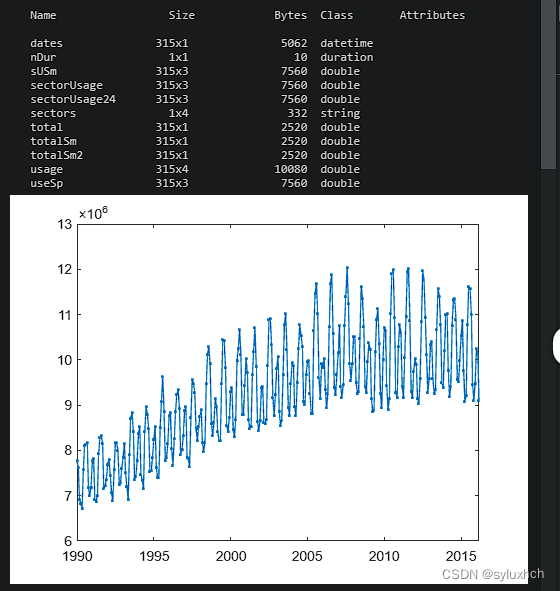
whos
total = usage(:,end);
sectorUsage = usage(:,1:3);
sectors = sectors(1:3);
plot(dates,total,".-")
说明1:
The table edata contains monthly electricity usage, in MWh, for the U.S., separated by sector. The matrix sectorUsage contains the consumption for three sectors (residential, commercial, and industrial). The vector total contains the total consumption. The months are stored in the datetime vector dates.
You can smooth the data using the smooth data function.
dataSm = smoothdata(data,"movmean",n)
When the data are evenly sampled, you do not need to specify the sample points.
任务1:
Calculate the 1-year moving average of total. Add this to the existing plot using point markers and a solid line. Repeat for the 2-year moving average.
解答1:
total12 = smoothdata(total,"movmean",12)
hold on
plot(dates,total12,".-")
total24 = smoothdata(total,"movmean",24)
plot(dates,total24,".-")
hold off
结果1:

说明2:
The smoothdata function works column-wise on matrices. The sectorUsage variable contains usage data from three sectors in its three columns.
任务2:
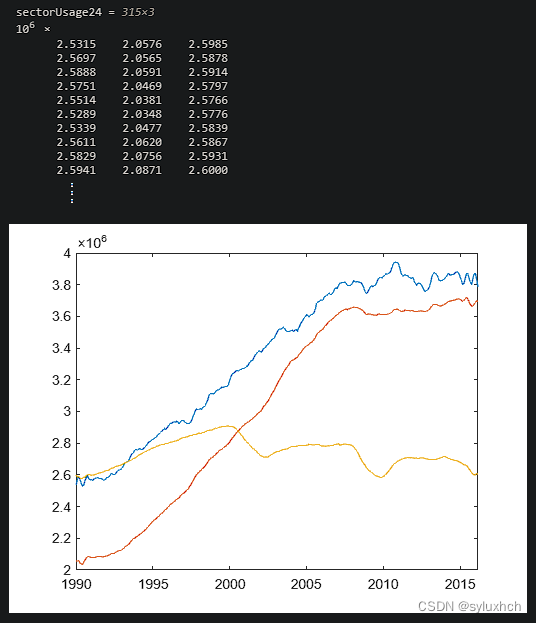
Calculate the 2-year moving average of all the sectors in sectorUsage. Create a new plot of the result against dates. Use solid lines and no markers.
解答2:
sectorUsage24 = smoothdata(sectorUsage,"movmean",24)
plot(dates,sectorUsage24,"-")
结果2:

附加练习:
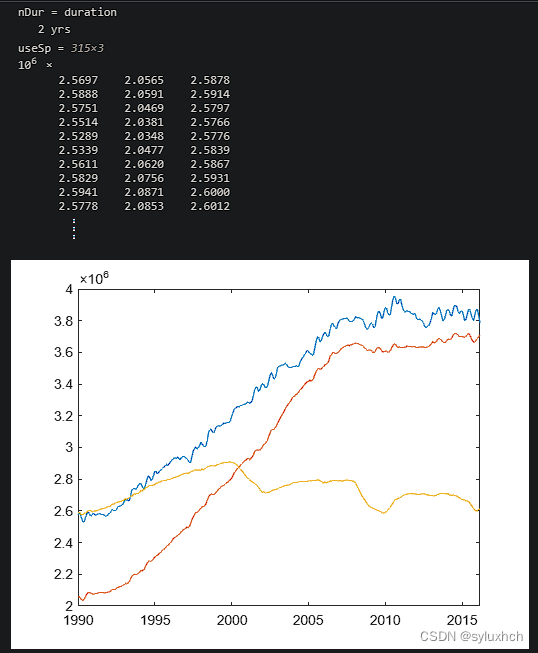
The dates are spaced one calendar month apart. However, the months have different lengths, so the usage data is spaced slightly unevenly. To use the dates as sample points, you need to specify the window length as a duration.
nDur = years(2)
useSp = smoothdata(sectorUsage,"movmean",...
    nDur,"SamplePoints",dates)
plot(dates,useSp)
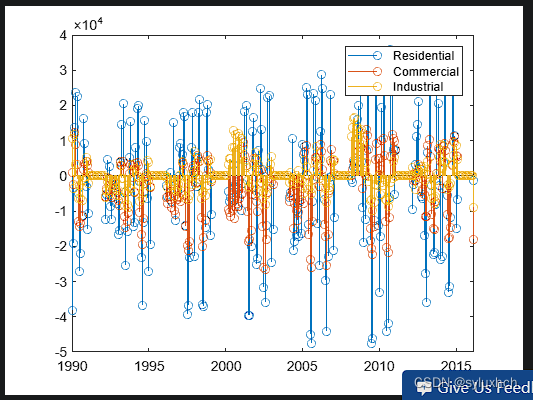
The data look almost identical, but a closer look at the difference reveals that they are not.
stem(dates,sectorUsage24-useSp)
legend(sectors)
Here, sectorUsage24 represents the 2-year moving average of all the sectors in sectorUsage, but you may have given this variable from the last task a different name.
附加代码:
nDur = years(2)
useSp = smoothdata(sectorUsage,"movmean",nDur,"SamplePoints",dates)
plot(dates,useSp)
stem(dates,sectorUsage24-useSp)
legend(sectors)
附加结果:


笔记:附加部分的练习到底有何不同,”SamplePoints“到底该怎么用?
猜你喜欢
网友评论
- 搜索
- 最新文章
- 热门文章
